안녕하세요.
이번 글에서는 CNN 모델이 학습한 후 어떻게 성능을 평가하는지 알아보도록 하겠습니다.
우선 지금까지 배운 코드를 정리하면 아래와 같습니다.
##관련 모듈 import##
import os
from tensorflow import keras
from tensorflow.keras.preprocessing.image import ImageDataGenerator
from tensorflow.keras import layers
from tensorflow import keras
##Data Load Code##
base_dir = './datasets/cats_and_dogs/'
train_dir = os.path.join(base_dir, 'train')
validation_dir = os.path.join(base_dir, 'validation')


train_datagen = ImageDataGenerator(
    featurewise_center=True,
    featurewise_std_normalization=True,
    rescale=1./255,
    rotation_range=20,
    width_shift_range=0.2,
    height_shift_range=0.2,
    horizontal_flip=True,
    validation_split=0.2)

 validation_datagen = ImageDataGenerator(rescale=1./255)


 train_generator = train_datagen.flow_from_directory(
        # 타깃 디렉터리
        train_dir,
        # 모든 이미지를 150 × 150 크기로 바꿉니다
        target_size=(150, 150),
        batch_size=32,
        # binary_crossentropy 손실을 사용하기 때문에 이진 레이블이 필요합니다
        class_mode='binary') #cats_and_dogs는 2개의 클래스만 있음

 validation_generator = validation_datagen.flow_from_directory(
        validation_dir,
        target_size=(150, 150),
        batch_size=32,
        class_mode='binary')
##CNN implementation by functional API##
input_shape = (150,150,3)
img_input = layers.Input(shape=input_shape)
output1 = layers.Conv2D(kernel_size=(3,3), filters=32, activation='relu')(img_input)
output2 = layers.MaxPooling2D((2,2))(output1)
output3 = layers.Conv2D(kernel_size=(3,3), filters=64, activation='relu')(output2)
output4 = layers.MaxPooling2D((2,2))(output3)
output5 = layers.Conv2D(kernel_size=(3,3), filters=128, activation='relu')(output4)
output6 = layers.MaxPooling2D((2,2))(output5)
output7 = layers.Conv2D(kernel_size=(3,3), filters=128, activation='relu')(output4)
output8 = layers.MaxPooling2D((2,2))(output7)
output9 = layers.Flatten()(output8)
output10 = layers.Dropout(0.5)(output9)
output11 = layers.Dense(512, activation='relu')(output10)
predictions = layers.Dense(2, activation='softmax')(output11)

model = keras.Model(inputs=img_input, outputs=predictions)

model.summary()
##Loss function, optimizer, learning rate schedule 설정
opt = SGD(lr=INIT_LR, momentum=0.9)
loss = CategoricalCrossentropy(label_smoothing=0.1)
model.compile(loss=loss, optimizer=opt, metrics=["accuracy"])
##Training 실행 코드##
train_step = train_generator.n // 32
valid_step = valid_generator.n // 32
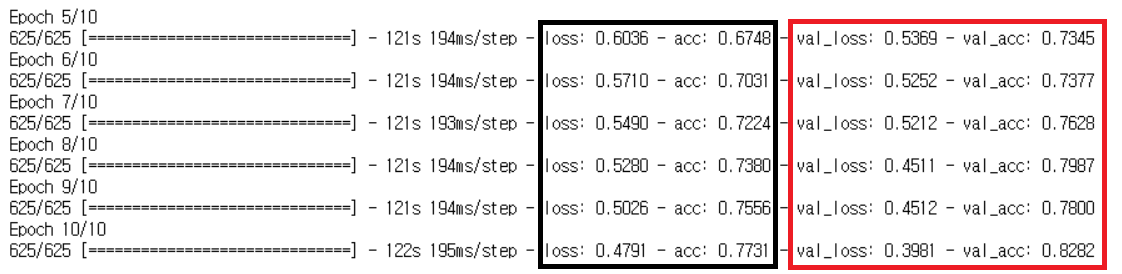
history = model.fit_generator(
train_generator,
steps_per_epoch=train_step,
epochs=30,
validation_data=validation_generator,
validation_steps=valid_step)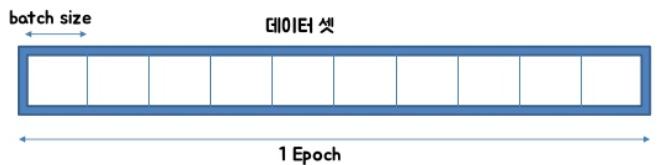
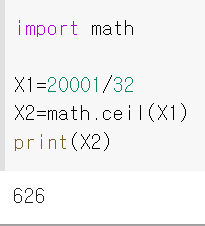
- step_per_epoch: 한 epoch에 사용한 스텝 수를 지정합니다. 총 20000개의 training sample이 있고 batch size가 32이므로, 20000를 32로 나눈 몫(=20000/32=625)이 됩니다. (만약, 20001개의 training sample이 있다면 step_per_epoch은 "(20001//32)+1"이 되어야 합니다) 이러한 이유로 위의 train_step, valid_step을 아래와 같이 변경시켜주는 것이 좋습니다.
- ex)총 45개의 훈련 샘플이 있고 배치사이즈가 3이라면 15 스텝(=step_per_epoch)으로 지정합니다.
- validation_step: 한 epoch 종료 시 마다 검증할 때 사용되는 검증 스텝 수를 지정합니다.
- ex) 총 15개의 validation 샘플이 있고 배치사이즈가 3이라면, validation_step을 5 스텝으로 지정합니다.
검은색: training sample/ 빨간색: validation sample
1. Metrics
딥러닝의 성능을 평가하기 위해 여러 성과지표(metrics)가 사용됩니다.
위에서 설명한 metrics은 accurcy로써 가장 대표적인 성과지표라 할 수 있습니다.
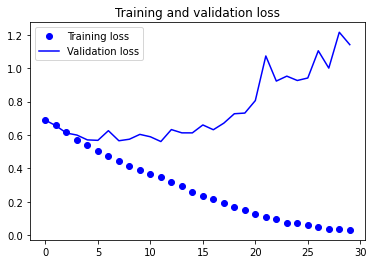
accuracy를 이용해 성과지표를 visualization하면 아래와 같이 표현할 수 있습니다.
import matplotlib.pyplot as plt

acc = history.history['accuracy']
val_acc = history.history['val_accuracy']
loss = history.history['loss']
val_loss = history.history['val_loss']

epochs = range(len(acc))

plt.plot(epochs, acc, 'bo', label='Training acc')
plt.plot(epochs, val_acc, 'b', label='Validation acc')
plt.title('Training and validation accuracy')
plt.legend()

plt.figure()

plt.plot(epochs, loss, 'bo', label='Training loss')
plt.plot(epochs, val_loss, 'b', label='Validation loss')
plt.title('Training and validation loss')
plt.legend()

plt.show()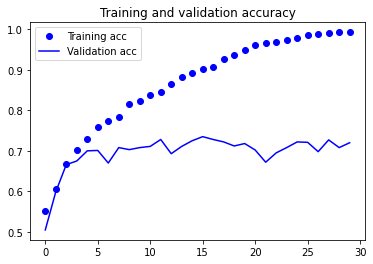
Test dataset을 evaluation하려면 아래와 같이 코드를 작성해주면 됩니다.
model.save('CNN_epoch_20.h5')

test_dir = os.path.join(base_dir, 'test')
test_datagen = ImageDataGenerator(rescale=1./255)
test_generator = test_datagen.flow_from_directory(
        test_dir,
        target_size=(150, 150),
        batch_size=32,
        class_mode='binary')

test_step = test_generator.n // 32

test_loss, test_acc = model.evaluate_generator(test_generator, steps=test_step, workers=4)
print(f'test loss : {test_loss:.4f} / test acc : {test_acc*100:.2f} %')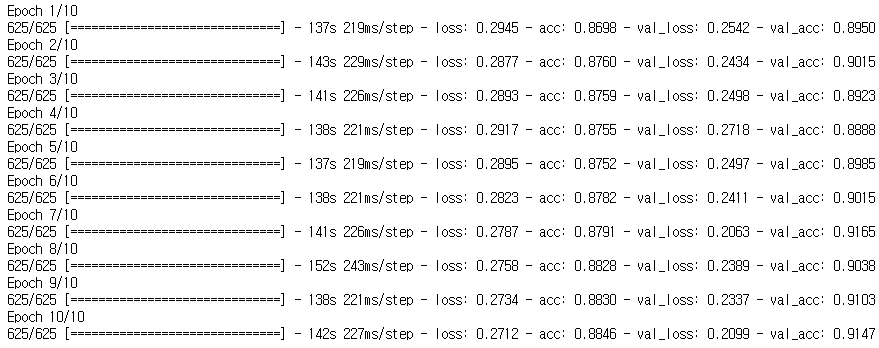
※loss function에 따라 metrics도 바뀔 수 있는 듯 합니다. (예전에 사용할 때 loss function을 categorical_crossentropy를 사용했을 때, 그냥 metrics를 accuracy로 해도 문제가 없었던것 같은데 나중에 바꿔서 써봐야겠네요)
model.compile(optimizer='adam',
              loss='sparse_categorical_crossentropy',
              metrics=['sparse_categorical_accuracy'])
2. Keras and Tensorflow backend metrics
모델 컴파일(model.compile) 할 때, Backend 엔진이 tensorflow(=tf)인 경우 몇 가지 기본 성과지표(ex: recall, precision 등을 제공해줍니다)
https://www.tensorflow.org/api_docs/python/tf/keras/metrics
Module: tf.keras.metrics | TensorFlow Core v2.5.0
Built-in metrics.
www.tensorflow.org
Keras tensorflow backend기반의 다양한 metrics 코드 구현 관련 내용은 아래 링크를 참고해주세요!
https://www.tensorflow.org/tutorials/structured_data/imbalanced_data?hl=ko
불균형 데이터 분류 | TensorFlow Core
이 튜토리얼에서는 한 클래스의 예시의 수가 다른 클래스보다 훨씬 많은 불균형 데이터세트를 분류하는 방법을 소개합니다. Kaggle에서 호스팅 되는 신용 카드 부정 행위 탐지 데이터세트를 사용
www.tensorflow.org
3. Keras and other backend metrics
하지만, Keras 2버전 부터는 tensorflow backend가 아니라면 아래 링크에서 제공되는 metrics를 제외하고서는 전부 사용자 정의 함수로 구현해주어야 합니다.
Metrics - Keras Documentation
측정항목의 사용법 측정항목은 모델의 성능을 평가하는데 사용되는 함수입니다. 측정항목 함수는 모델이 컴파일 될 때 metrics 매개변수를 통해 공급됩니다. model.compile(loss='mean_squared_error', optimize
keras.io
실제로 Keras 2에서 precision, recall, fmeasure 등과 같은 metrics는 따로 구현해야 한다고 언급하고 있네요.
"Several legacy metric functions have been removed, namely matthews_correlation, precision, recall, fbeta_score, fmeasure."
https://github.com/keras-team/keras/wiki/Keras-2.0-release-notes
keras-team/keras
Deep Learning for humans. Contribute to keras-team/keras development by creating an account on GitHub.
github.com
Keras기반의 사용자 정의 함수(metrics) 코드 구현 관련 내용은 아래 링크를 참고해주세요!
https://neptune.ai/blog/keras-metrics
Keras Metrics: Everything You Need To Know - neptune.ai
Keras metrics are functions that are used to evaluate the performance of your deep learning model. Choosing a good metric for your problem is usually a difficult task. you need to understand which metrics are already available in Keras and tf.keras and h
neptune.ai
[Reference Site]
Jupyter Notebook Viewer
이제 2,000개의 훈련 이미지, 1,000개의 검증 이미지, 1,000개의 테스트 이미지가 준비되었습니다. 분할된 각 데이터는 클래마다 동일한 개수의 샘플을 포함합니다. 균형잡힌 이진 분류 문제이므로
nbviewer.jupyter.org
https://junstar92.tistory.com/119
[Tensorflow][Kaggle] Cats vs. Dogs Classification(수정 : 2020-12-07)
www.kaggle.com/c/dogs-vs-cats-redux-kernels-edition Dogs vs. Cats Redux: Kernels Edition Distinguish images of dogs from cats www.kaggle.com 딥러닝 연습으로 Kaggle의 Dogs vs. Cats Classification을..
junstar92.tistory.com
https://m.blog.naver.com/wideeyed/221226716255
[Keras] 2.0에서 precision,recall 사용하기
tf.keras.metrics를 통해 precision, recall을 지원하므로 사용한다. 다른 Backend엔진을 사용하거나 더 ...
blog.naver.com
'Tensorflow > 2.CNN' 카테고리의 다른 글
| 6. 총 정리 코드 (0) | 2021.06.30 |
|---|---|
| 5.Pre-trained model 불러오기 (feat. Transfer Learning and .h5 파일) (0) | 2021.06.30 |
| 3.CNN 모델의 loss function 및 optimizer 설정 (0) | 2021.06.29 |
| 2.CNN 모델 구현 (Feat. Sequential or Function API) (0) | 2021.06.29 |
| 1.Data Load 및 Preprocessing (전처리) (0) | 2021.06.28 |